
Abstract
Aim
Prostate cancer is a leading cause of cancer death among men in the United States. We examined temporal trends in mortality from 1999 to 2020 and characterized disparities by race, Hispanic origin, census region, state, age group, and urban-rural residence.
Methods
This population-based, retrospective, serial cross-sectional study analyzed the Centers for Disease Control and Prevention Wide-ranging Online Data for Epidemiologic Research (CDC WONDER) Multiple Cause of Death database. Deaths for which prostate cancer was the underlying cause were identified using the International Classification of Diseases, Tenth Revision code C61. Age-adjusted mortality rates (AAMRs) per 100,000 men were standardized to the 2000 United States standard population. Joinpoint regression identified the years at which the trend changed and estimated the annual percent change (APC).
Results
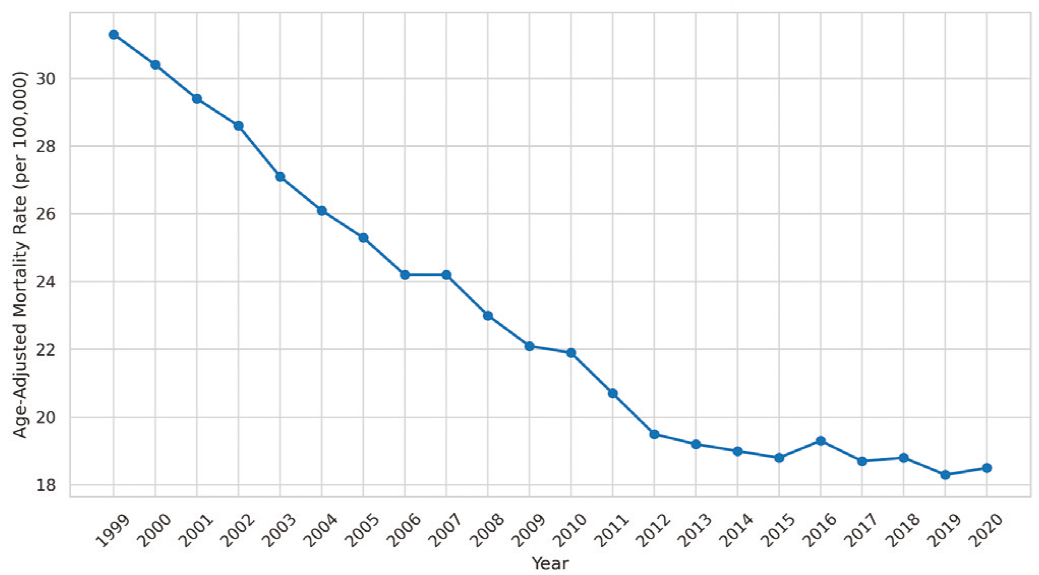
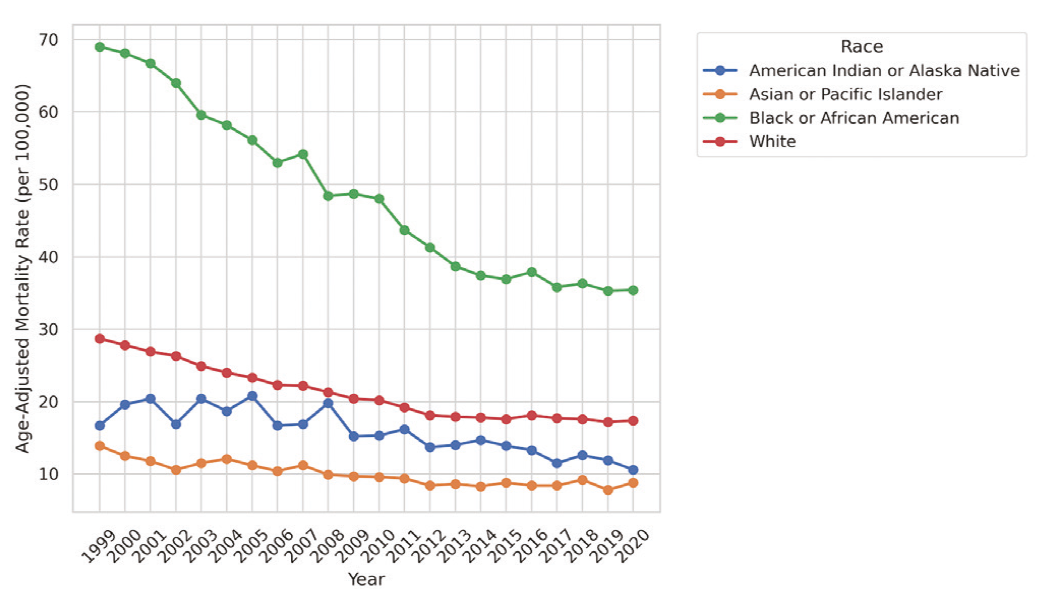
A total of 650,802 prostate cancer deaths were recorded. The AAMR declined from 31.3 to 18.5 per 100,000 men, a reduction of 40.9%. A trend change occurred in 2013, with the APC falling from -3.45% during 1999-2013 to -0.59% during 2014-2020. AAMRs among Black men declined from 69.0 to 35.4, and those among White men declined from 28.7 to 17.4, narrowing the Black-to-White ratio from 2.40 to 2.03. State-level AAMRs ranged from 36.8 in the District of Columbia to 16.2 in Hawaii.
Conclusion
In this historical 1999-2020 analysis, prostate cancer mortality declined substantially, but progress slowed markedly after 2013. Racial disparities narrowed but did not close; the relative urban-rural disadvantage persisted; regional differences did not narrow uniformly. Continued surveillance and targeted intervention where the burden remains highest are warranted.
Keywords: Prostatic neoplasms, mortality, health status disparities, epidemiology, United States
Introduction
Prostate cancer is the most commonly diagnosed noncutaneous malignancy among men in the United States (U.S.) and remains a major cause of cancer-related mortality []. Mortality rates have declined substantially since the mid-1990s. Between 2004 and 2015, docetaxel [], abiraterone [], enzalutamide [], and the addition of docetaxel to androgen deprivation therapy for hormone-sensitive disease [] demonstrated survival benefits and entered clinical practice. At the population level, these advances might have been expected to sustain, or even accelerate, the decline in prostate cancer mortality.
Screening practice moved in the opposite direction. In 2012, the United States Preventive Services Task Force (USPSTF) recommended against prostate-specific antigen (PSA) screening for men of all ages []. Screening rates then declined [], and national surveillance subsequently showed an increase in the incidence of advanced-stage disease [, ]. Whether these opposing forces altered prostate cancer mortality or affected population groups differently remains unclear. Racial, geographic, age-related, and urban-rural disparities are well documented [-]. Earlier national analyses also reported a slowing decline in mortality [-]. The incremental question addressed here was not whether mortality declined, but whether the timing of the slowing and the evolution of absolute and relative disparities were consistent across demographic and geographic strata within one analytic framework.
We analyzed national death certificate data from 1999 through 2020 to describe trends in prostate cancer mortality among men in the U.S. and to characterize disparities by race, Hispanic origin, census region, state, age group, and urban-rural residence. We applied joinpoint regression to the overall, race, Hispanic-origin, and census-region series to compare the calendar years in which the slope changed. We also examined endpoint changes and full-period trends across age and urban-rural strata, allowing absolute and relative disparity patterns to be evaluated alongside subgroup-specific inflection years.
Methods
Study Design and Data Source
This population-based, retrospective, serial cross-sectional study examined trends in prostate cancer mortality among men in the U.S. from 1999 through 2020 and characterized demographic, geographic, age-related, and urban-rural disparities in those trends. Mortality data came from the Centers for Disease Control and Prevention Wide-ranging Online Data for Epidemiologic Research (CDC WONDER) Multiple Cause of Death database []. The analytic dataset was constructed from the 1999-2020 CDC WONDER extract and locked in 2020. The endpoint, therefore, reflects the dataset used in this analysis, not the current endpoint of data availability in CDC WONDER.
We identified prostate cancer deaths using International Classification of Diseases, Tenth Revision (ICD-10) code C61, which denotes malignant neoplasm of the prostate. Although the data came from the Multiple Cause of Death file, we counted only deaths for which prostate cancer was the underlying cause rather than those in which it was a contributing cause.
Study Population
The study included male decedents in the U.S. from 1999 through 2020 whose underlying cause of death was prostate cancer. Total-sex summary rows were excluded to avoid double counting. We extracted deaths by calendar year and stratified them by race, Hispanic origin, census region, state, age group, and the 2013 National Center for Health Statistics Urban-Rural Classification Scheme [].
Category definitions for race, Hispanic origin, census region, and urban-rural classification followed the standard CDC WONDER groupings and were reported in the corresponding tables. State-level analyses included all states and the District of Columbia. Age-specific analyses included men aged 45 years or older, categorized using the CDC WONDER age groups; younger age groups were excluded from analysis because death counts were too small to yield reliable rates. Estimates flagged by CDC WONDER as suppressed or unreliable were excluded at the individual stratum-year level rather than excluding the entire subgroup, and subgroups were modeled whenever sufficient usable annual observations remained to estimate trends.
Outcomes and Mortality Measures
The primary outcome was the annual age-adjusted mortality rate (AAMR) for prostate cancer, expressed per 100,000 men and standardized to the 2000 U.S. standard population []. CDC WONDER provided these rates with their 95% confidence intervals (CIs). Secondary outcomes were annual death counts; crude, subgroup-specific, and age-specific rates; relative change between 1999 and 2020; annual percent change (APC); average APC (AAPC); and state-level AAMRs.
For age-group analyses, we used crude age-specific rates rather than AAMRs, because rates within a single age stratum require no further age standardization. We calculated the relative change as [(rate in 2020 - rate in 1999) / rate in 1999] × 100.
Statistical Analysis
We performed all analyses and generated all figures in Python version 3.12. Death counts are reported as frequencies, percentages, and rates, with 95% CIs where available.
We assessed overall trends and trends by race, Hispanic origin, and census region using joinpoint regression fitted as segmented log-linear models of annual AAMRs. A joinpoint is a calendar year at which the slope of the log-linear trend changes. We estimated AAPC across the full study period [] and APC within each segment. We report APC and AAPC as percentages, with 95% CIs and p-values; negative values indicate declining mortality.
We implemented joinpoint regression directly in Python using the joinpoint regression model and grid-search fitting method described by Kim et al. []; we did not use the National Cancer Institute Joinpoint Regression Program, and we selected the number of joinpoints by the Bayesian information criterion rather than by the permutation tests proposed in that report. Joinpoints were placed at integer calendar years, and each segment was required to span at least three calendar years. We allowed between zero and three joinpoints; given this number, knot locations were chosen by an exhaustive grid search over all admissible combinations, and the model with the smallest residual sum of squares was retained. Segments were constrained to join at the knots rather than being fitted as separate regressions. APC was equal to [exp(β) - 1] × 100 for each segment slope β, and we derived CIs from the pooled residual variance of the full model using the t distribution, assuming constant variance and uncorrelated errors. Because model selection and inference differed, the selected joinpoints and uncertainty estimates may not match those produced by the NCI software.
Joinpoint models were restricted to the overall, race, Hispanic-origin, and census-region series because the primary change-point question was whether the timing of broad population-level inflections differed across these strata. Age-specific and urban-rural analyses were designated as supportive disparity analyses and summarized with one log-linear model per stratum across the full study period, using crude age-specific rates and AAMRs, respectively. This parsimonious hierarchy limited the proliferation of data-driven change-point searches across multiple correlated subgroup series. The resulting full-period estimates should not be interpreted as evidence that within-period slope changes did not occur in the age or urban-rural strata. We considered two-sided p-values below 0.05 to be significant. No adjustment was made for multiple comparisons; subgroup-specific results were therefore interpreted descriptively.
We calculated the Black-to-White mortality rate ratio for 1999 and 2020 by dividing the AAMR among Black or African American men by the corresponding AAMR among White men.
We assessed state-level variation by ranking states and the District of Columbia by their overall AAMR, pooled across the study period.
Ethical Considerations
This study used publicly available, aggregated, de-identified data from CDC WONDER. No individual-level data, protected health information, or identifiable records were accessed. Institutional review board approval and informed consent were therefore not required. We complied with the CDC WONDER data use restrictions.
Results
Overall Mortality Burden
Between 1999 and 2020, 650,802 men in the U.S. died, with prostate cancer recorded as the underlying cause of death. The AAMR decreased from 31.3 per 100,000 in 1999 to 18.5 per 100,000 in 2020, a decline of 40.9% (, ). The annual number of deaths followed a different pattern, falling from 31,729 in 1999 to a low of 27,245 in 2012, then rising to 32,707 in 2020, above the count at the start of the period ().
Table 1. Distribution of prostate cancer deaths and age-adjusted mortality rates by demographic and geographic characteristics, United States, 1999-2020
Characteristic | Deaths, n | Deaths, % | AAMR in 1999 | AAMR in 2020 | Relative change, % |
|---|---|---|---|---|---|
Overall | 650,802 | 100.0 | 31.3 | 18.5 | -40.9 |
Race | - | - | - | - | - |
White | 529,005 | 81.3 | 28.7 | 17.4 | -39.4 |
Black or African American | 109,081 | 16.8 | 69.0 | 35.4 | -48.7 |
Asian or Pacific Islander | 10,037 | 1.5 | 13.9 | 8.8 | -36.7 |
American Indian or Alaska Native | 2,679 | 0.4 | 16.7 | 10.6 | -36.5 |
Hispanic origin | - | - | - | - | - |
Not Hispanic or Latino | 615,181 | 94.5 | 31.7 | 18.9 | -40.4 |
Hispanic or Latino | 34,230 | 5.3 | 23.0 | 14.2 | -38.3 |
Not stated | 1,391 | 0.2 | NA | NA | NA |
Census region | - | - | - | - | - |
Northeast | 122,654 | 18.8 | 30.6 | 16.9 | -44.8 |
Midwest | 148,677 | 22.8 | 32.1 | 19.0 | -40.8 |
South | 238,167 | 36.6 | 32.8 | 18.2 | -44.5 |
West | 141,304 | 21.7 | 28.9 | 19.6 | -32.2 |
AAMR indicates age-adjusted mortality rate per 100,000 men. Prostate cancer deaths were identified using ICD-10 code C61 as the underlying cause of death in CDC WONDER Multiple Cause of Death data. Female and total-sex rows were excluded. Relative change was calculated as [(AAMR in 2020 - AAMR in 1999) / AAMR in 1999] × 100.
AAMR: Age-adjusted mortality rate, NA: Not available, ICD-10: International Classification of Diseases, Tenth Revision, CDC WONDER: Centers for Disease Control and Prevention Wide-ranging Online Data for Epidemiologic Research
AAMR: Age-adjusted mortality rate, ICD-10: International Classification of Diseases, Tenth Revision
Table 2. Annual prostate cancer mortality trends among men in the United States, 1999-2020
Year | Deaths, n | Population | Crude mortality rate | 95% CI | AAMR | 95% CI |
|---|---|---|---|---|---|---|
1999 | 31,729 | 136,802,873 | 23.2 | 22.9 to 23.4 | 31.3 | 31.0 to 31.7 |
2000 | 31,078 | 138,053,563 | 22.5 | 22.3 to 22.8 | 30.4 | 30.0 to 30.7 |
2001 | 30,719 | 139,891,492 | 22.0 | 21.7 to 22.2 | 29.4 | 29.0 to 29.7 |
2002 | 30,446 | 141,230,559 | 21.6 | 21.3 to 21.8 | 28.6 | 28.3 to 28.9 |
2003 | 29,554 | 142,428,897 | 20.8 | 20.5 to 21.0 | 27.1 | 26.8 to 27.4 |
2004 | 29,004 | 143,828,012 | 20.2 | 19.9 to 20.4 | 26.1 | 25.8 to 26.4 |
2005 | 28,905 | 145,197,078 | 19.9 | 19.7 to 20.1 | 25.3 | 25.0 to 25.6 |
2006 | 28,372 | 146,647,265 | 19.3 | 19.1 to 19.6 | 24.2 | 23.9 to 24.5 |
2007 | 29,093 | 148,064,854 | 19.6 | 19.4 to 19.9 | 24.2 | 23.9 to 24.5 |
2008 | 28,472 | 149,489,951 | 19.0 | 18.8 to 19.3 | 23.0 | 22.7 to 23.2 |
2009 | 28,088 | 150,807,454 | 18.6 | 18.4 to 18.8 | 22.1 | 21.8 to 22.4 |
2010 | 28,561 | 151,781,326 | 18.8 | 18.6 to 19.0 | 21.9 | 21.7 to 22.2 |
2011 | 27,970 | 153,290,819 | 18.2 | 18.0 to 18.5 | 20.7 | 20.5 to 21.0 |
2012 | 27,245 | 154,492,067 | 17.6 | 17.4 to 17.8 | 19.5 | 19.3 to 19.7 |
2013 | 27,682 | 155,651,602 | 17.8 | 17.6 to 18.0 | 19.2 | 18.9 to 19.4 |
2014 | 28,344 | 156,936,487 | 18.1 | 17.9 to 18.3 | 19.0 | 18.8 to 19.2 |
2015 | 28,848 | 158,229,297 | 18.2 | 18.0 to 18.4 | 18.8 | 18.6 to 19.0 |
2016 | 30,370 | 159,078,923 | 19.1 | 18.9 to 19.3 | 19.3 | 19.1 to 19.5 |
2017 | 30,488 | 160,408,119 | 19.0 | 18.8 to 19.2 | 18.7 | 18.5 to 19.0 |
2018 | 31,489 | 161,128,679 | 19.5 | 19.3 to 19.8 | 18.8 | 18.6 to 19.0 |
2019 | 31,638 | 161,657,324 | 19.6 | 19.4 to 19.8 | 18.3 | 18.1 to 18.5 |
2020 | 32,707 | 162,256,202 | 20.2 | 19.9 to 20.4 | 18.5 | 18.3 to 18.7 |
AAMR indicates age-adjusted mortality rate per 100,000 men. Prostate cancer deaths were identified using ICD-10 code C61 as the underlying cause of death. Crude and age-adjusted mortality rates are expressed per 100,000 men. Female and total-sex rows were excluded.
AAMR: Age-adjusted mortality rate, ICD-10: International Classification of Diseases, Tenth Revision, CI: Confidence interval
Racial and Ethnic Disparities
Black men had the highest mortality throughout the study period. Their AAMR fell from 69.0 per 100,000 in 1999 to 35.4 in 2020 but remained well above the rate among White men, which fell from 28.7 to 17.4 (, ). The Black-to-White ratio was 2.40 in 1999 and 2.03 in 2020. Men of Hispanic origin had lower mortality than men not of Hispanic origin; AAMR fell from 23.0 to 14.2 per 100,000 (-38.3%) among Hispanic men, compared with a decline from 31.7 to 18.9 per 100,000 (-40.4%) among men not of Hispanic origin. Among Hispanic men, we identified two joinpoints, in 2002 and 2014, with a continued decline in the final segment (APC, -1.14%; p=0.007) ().
AAMR: Age-adjusted mortality rate, ICD-10, International Classification of Diseases, Tenth Revision, CDC WONDER: Centers for Disease Control and Prevention Wide-ranging Online Data for Epidemiologic Research
Table 3. Joinpoint regression analysis of prostate cancer mortality trends by demographic and geographic subgroups, 1999-2020
Category | Subgroup | Joinpoint year(s) | Period | APC / AAPC, % | 95% CI | p value |
|---|---|---|---|---|---|---|
Overall | Overall | 2013 | 1999-2020 | -2.48 | -2.56 to -2.40 | <0.001 |
- | - | - | 1999-2013 | -3.45 | -3.58 to -3.32 | <0.001 |
- | - | - | 2014-2020 | -0.59 | -0.88 to -0.30 | 0.001 |
Race | White | 2013 | 1999-2020 | -2.34 | -2.41 to -2.27 | <0.001 |
- | - | - | 1999-2013 | -3.32 | -3.44 to -3.20 | <0.001 |
- | - | - | 2014-2020 | -0.40 | -0.68 to -0.12 | 0.011 |
- | Black or African American | 2010, 2014 | 1999-2020 | -2.91 | -3.07 to -2.76 | <0.001 |
- | - | - | 1999-2010 | -3.66 | -3.96 to -3.35 | <0.001 |
- | - | - | 2011-2014 | -5.49 | -6.28 to -4.69 | <0.001 |
- | - | - | 2015-2020 | -0.84 | -1.52 to -0.15 | 0.029 |
- | Asian or Pacific Islander | 2014 | 1999-2020 | -1.98 | -2.32 to -1.65 | <0.001 |
- | - | - | 1999-2014 | -2.84 | -3.35 to -2.33 | <0.001 |
- | - | - | 2015-2020 | 0.24 | -1.26 to 1.77 | 0.758 |
- | American Indian or Alaska Native | 2003 | 1999-2020 | -1.98 | -2.56 to -1.39 | <0.001 |
- | - | - | 1999-2003 | 3.18 | -0.38 to 6.87 | 0.097 |
- | - | - | 2004-2020 | -3.34 | -3.98 to -2.70 | <0.001 |
Hispanic origin | Not Hispanic or Latino | 2013 | 1999-2020 | -2.44 | -2.52 to -2.36 | <0.001 |
- | - | - | 1999-2013 | -3.45 | -3.58 to -3.32 | <0.001 |
- | - | - | 2014-2020 | -0.45 | -0.74 to -0.15 | 0.008 |
- | Hispanic or Latino | 2002, 2014 | 1999-2020 | -1.88 | -2.11 to -1.64 | <0.001 |
- | - | - | 1999-2002 | 0.12 | -1.56 to 1.83 | 0.888 |
- | - | - | 2003-2014 | -3.08 | -3.39 to -2.76 | <0.001 |
- | - | - | 2015-2020 | -1.14 | -1.87 to -0.41 | 0.007 |
Census region | Northeast | 2012 | 1999-2020 | -2.77 | -2.90 to -2.64 | <0.001 |
- | - | - | 1999-2012 | -3.66 | -3.90 to -3.42 | <0.001 |
- | - | - | 2013-2020 | -1.49 | -1.92 to -1.06 | <0.001 |
- | Midwest | 2013 | 1999-2020 | -2.44 | -2.53 to -2.35 | <0.001 |
- | - | - | 1999-2013 | -3.55 | -3.69 to -3.40 | <0.001 |
- | - | - | 2014-2020 | -0.22 | -0.55 to 0.11 | 0.207 |
- | South | 2009, 2013 | 1999-2020 | -2.50 | -2.59 to -2.41 | <0.001 |
- | - | - | 1999-2009 | -3.56 | -3.75 to -3.37 | <0.001 |
- | - | - | 2010-2013 | -4.19 | -4.63 to -3.74 | <0.001 |
- | - | - | 2014-2020 | -0.68 | -1.00 to -0.37 | 0.001 |
- | West | 2009, 2013 | 1999-2020 | -1.68 | -1.83 to -1.53 | <0.001 |
- | - | - | 1999-2009 | -2.55 | -2.88 to -2.21 | <0.001 |
- | - | - | 2010-2013 | -3.41 | -4.17 to -2.64 | <0.001 |
- | - | - | 2014-2020 | 0.11 | -0.44 to 0.65 | 0.707 |
Bold rows represent AAPC values for the full 1999-2020 study period; nonbold rows represent APC values for joinpoint-defined segments. Joinpoint years indicate calendar years at which the slope of the log-linear mortality trend changed. Mortality rates were age-adjusted and expressed per 100,000 men. Prostate cancer deaths were identified using ICD-10 code C61 as the underlying cause of death. Joinpoint regression was implemented as segmented log-linear regression of annual age-adjusted mortality rates using Python version 3.12. Negative APC or AAPC values indicate decreasing mortality over time.
APC: Annual percent change, AAPC: Average annual percent change, CI: Confidence interval, ICD-10: International Classification of Diseases, Tenth Revision
Joinpoint Analysis
Joinpoint regression showed that the overall decline slowed after the early 2010s. The AAMR fell sharply from 1999 to 2013 (APC, -3.45%; 95% CI, -3.58 to -3.32; p<0.001), and then fell far more slowly from 2014 to 2020 (APC, -0.59%; 95% CI, -0.88 to -0.30; p=0.001) (). White men, non-Hispanic men, and men in the Midwest shared the same joinpoint in 2013. Black men had two joinpoints in 2010 and 2014; their steepest decline occurred between 2011 and 2014 (APC, -5.49%; 95% CI, -6.28 to -4.69; p<0.001), followed by a much flatter segment from 2015 to 2020 (APC, -0.84%; 95% CI, -1.52 to -0.15; p=0.029). In the most recent segment, the decline was no longer significant among Asian or Pacific Islander men, among those in the Midwest, or among those in the West.
Geographic Variation
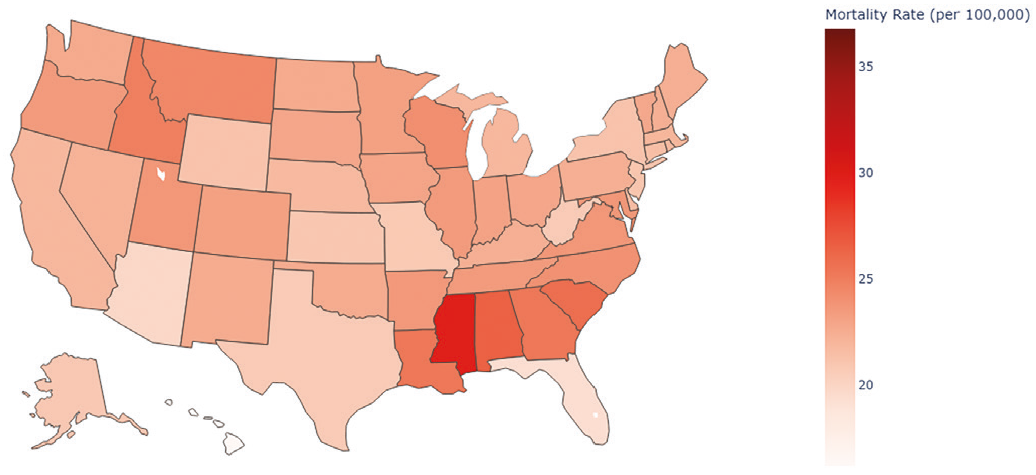
Mortality declined in all four census regions, but by different amounts. The AAMR fell from 30.6 to 16.9 per 100,000 in the Northeast (-44.8%), from 32.8 to 18.2 in the South (-44.5%), from 32.1 to 19.0 in the Midwest (-40.8%), and from 28.9 to 19.6 in the West (-32.2%) (). The West had the lowest regional rate in 1999, the highest in 2020, and the slowest average annual decline over the period (AAPC, -1.68%). Across states, AAMR varied 2.27-fold, from 36.8 per 100,000 in the District of Columbia to 16.2 in Hawaii. The other states with the highest rates were clustered in the South (, , ).
ICD-10: International Classification of Diseases, Tenth Revision, CDC WONDER: Centers for Disease Control and Prevention Wide-ranging Online Data for Epidemiologic Research
Table 4. States with the highest and lowest age-adjusted prostate cancer mortality rates among men, United States, 1999-2020
Rank category | State | Deaths, n | Population | Crude mortality rate | AAMR | 95% CI for AAMR |
|---|---|---|---|---|---|---|
Highest AAMR | District of Columbia | 1,788 | 6,447,945 | 27.7 | 36.8 | 35.0 to 38.5 |
- | Mississippi | 7,627 | 31,311,884 | 24.4 | 29.8 | 29.1 to 30.5 |
- | Alabama | 11,664 | 50,162,467 | 23.3 | 26.5 | 26.0 to 27.0 |
- | South Carolina | 10,943 | 48,913,736 | 22.4 | 25.8 | 25.3 to 26.3 |
- | Georgia | 17,563 | 102,335,638 | 17.2 | 25.3 | 25.0 to 25.7 |
- | Louisiana | 9,900 | 48,820,717 | 20.3 | 25.3 | 24.8 to 25.8 |
- | Idaho | 3,634 | 16,986,639 | 21.4 | 24.9 | 24.1 to 25.7 |
- | Montana | 2,740 | 10,860,288 | 25.2 | 24.5 | 23.6 to 25.5 |
- | Wisconsin | 13,881 | 61,530,044 | 22.6 | 24.1 | 23.7 to 24.5 |
- | North Carolina | 19,976 | 100,275,492 | 19.9 | 24.0 | 23.6 to 24.3 |
Lowest AAMR | Wyoming | 1,123 | 6,117,057 | 18.4 | 21.2 | 20.0 to 22.5 |
- | New Jersey | 18,049 | 93,721,439 | 19.3 | 21.1 | 20.8 to 21.5 |
- | Kansas | 5,973 | 30,800,290 | 19.4 | 21.0 | 20.4 to 21.5 |
- | Alaska | 829 | 7,965,027 | 10.4 | 20.9 | 19.3 to 22.5 |
- | Missouri | 12,394 | 63,685,103 | 19.5 | 20.8 | 20.5 to 21.2 |
- | Texas | 38,490 | 272,510,495 | 14.1 | 20.7 | 20.4 to 20.9 |
- | West Virginia | 4,283 | 19,757,232 | 21.7 | 20.7 | 20.1 to 21.4 |
- | Arizona | 13,189 | 68,702,182 | 19.2 | 19.8 | 19.4 to 20.1 |
- | Florida | 48,675 | 202,218,145 | 24.1 | 19.3 | 19.1 to 19.4 |
- | Hawaii | 2,510 | 14,808,963 | 16.9 | 16.2 | 15.6 to 16.9 |
AAMR indicates age-adjusted mortality rate per 100,000 men. Prostate cancer deaths were identified using ICD-10 code C61 as the underlying cause of death in CDC WONDER Multiple Cause of Death data. Crude and age-adjusted mortality rates are expressed per 100,000 men. Rankings were based on AAMR across the entire 1999-2020 study period. The District of Columbia was included as a state-level jurisdiction.
AAMR: Age-adjusted mortality rate, CI: Confidence interval, ICD-10: International Classification of Diseases, Tenth Revision, CDC WONDER: Centers for Disease Control and Prevention Wide-ranging Online Data for Epidemiologic Research
Age-specific Mortality
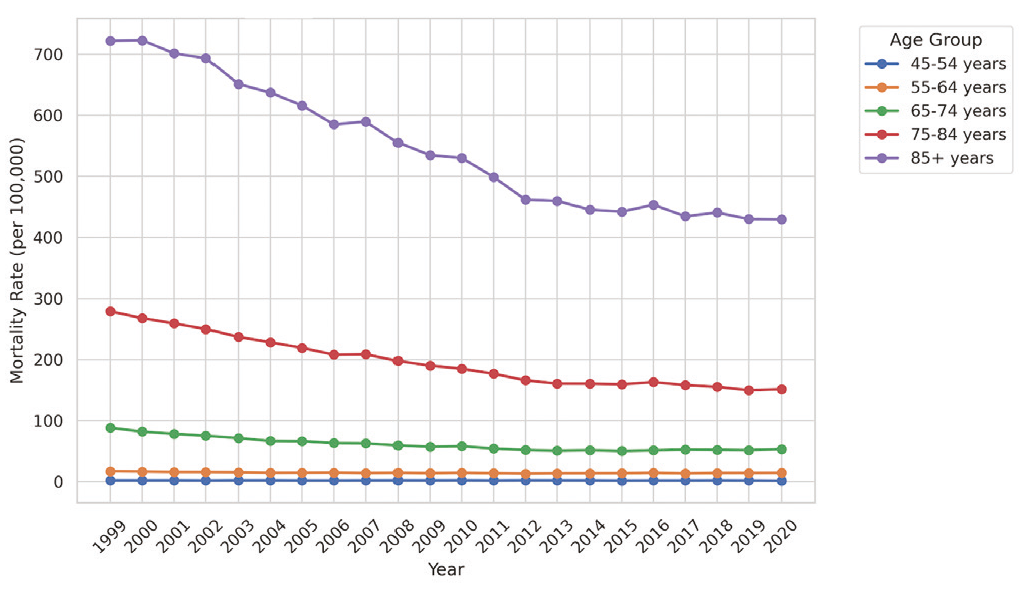
Mortality rose steeply with age. In 1999, the crude age-specific rate ranged from 2.1 per 100,000 in men aged 45 to 54 years to 722.4 per 100,000 in men aged 85 years and older, representing an approximately 340-fold gradient (, ). Mortality declined in every age group. The largest relative declines occurred in older men: 45.7% aged 75 to 84 years (AAPC, -3.02%; p<0.001), 40.5% aged 85 years and older (AAPC, -2.81%; p<0.001), and 39.7% aged 65 to 74 years (AAPC, -2.46%; p<0.001). Declines were smaller in younger men: 23.8% for those aged 45 to 54 years (AAPC, -0.51%; p=0.031) and 15.8% for those aged 55 to 64 years (AAPC, -0.75%; p<0.001).
ICD-10: International Classification of Diseases, Tenth Revision
Table 5. Age-specific prostate cancer mortality trends among men in the United States, 1999-2020
Age group | Deaths, n | Population | Mortality rate in 1999 | 95% CI | Mortality rate in 2020 | 95% CI | Relative change, % | AAPC, % | 95% CI | p value |
|---|---|---|---|---|---|---|---|---|---|---|
45-54 years | 9,089 | 456,507,175 | 2.1 | 1.9 to 2.3 | 1.6 | 1.5 to 1.8 | -23.8 | -0.51 | -0.97 to -0.05 | 0.031 |
55-64 years | 53,303 | 369,467,361 | 17.1 | 16.3 to 17.8 | 14.4 | 13.8 to 14.9 | -15.8 | -0.75 | -1.07 to -0.44 | <0.001 |
65-74 years | 140,563 | 236,529,573 | 88.2 | 86.2 to 90.2 | 53.2 | 52.1 to 54.4 | -39.7 | -2.46 | -2.92 to -2.00 | <0.001 |
75-84 years | 241,452 | 125,077,029 | 279.1 | 274.4 to 283.8 | 151.5 | 148.7 to 154.3 | -45.7 | -3.02 | -3.31 to -2.73 | <0.001 |
≥85 years | 205,786 | 39,237,937 | 722.4 | 707.1 to 737.6 | 429.7 | 421.4 to 437.9 | -40.5 | -2.81 | -3.08 to -2.55 | <0.001 |
Mortality rates are age-specific crude rates per 100,000 men within each age group and are not age-adjusted. Prostate cancer deaths were identified using ICD-10 code C61 as the underlying cause of death. Female rows and age groups with no or very small numbers of deaths were excluded. AAPC values were estimated using log-linear regression of annual age-specific mortality rates from 1999 to 2020. Negative values indicate decreasing mortality over time.
CI: Confidence interval, AAPC: Annual percent change average, ICD-10: International Classification of Diseases, Tenth Revision
Urban-rural Differences
Nonmetropolitan areas had higher AAMRs at both ends of the period. In 1999, the AAMR was 33.5 per 100,000 in noncore nonmetropolitan areas and 33.3 per 100,000 in micropolitan nonmetropolitan areas, compared with 30.1 to 31.4 per 100,000 across the four metropolitan categories. By 2020, those values were 19.3 and 19.5 in nonmetropolitan areas, and 17.4 to 18.9 in metropolitan areas (). Relative declines were similar across all six categories, ranging from 39.8% in large central metropolitan areas to 42.4% in noncore nonmetropolitan areas; the AAPCs were similar, ranging from -2.56% to -2.94%. Mortality, therefore, fell along near-parallel paths in every residence category: the absolute urban-rural difference narrowed from 3.4 to 2.1 per 100,000, while the ratio of the highest nonmetropolitan to the lowest metropolitan rate remained essentially unchanged (1.11 in 1999, 1.12 in 2020).
Discussion
Over a 22-year period during which 650,802 deaths occurred, age-adjusted prostate cancer mortality fell by 40.9%, but the decline was not uniform over time. Joinpoint regression identified a change in 2013, after which the decline slowed, from 3.45% per year to 0.59% per year. Slowing appeared across the broad strata examined using joinpoint regression, supporting a national inflection, although its timing and magnitude differed by subgroup. Annual deaths rose after 2012, and by 2020 had exceeded the 1999 count. This divergence was consistent with population growth and aging, and did not indicate a reversal in the underlying mortality rate.
The 2013 inflection coincided with a period of change in early detection. In 2018, the USPSTF revised the 2012 recommendation toward individualized decision-making in men aged 55 to 69 years []. Temporal coincidence does not establish causation. Randomized trials suggest that mortality responds to a change in screening practice only after 5 to 10 years [, ], which makes it difficult to attribute the 2013 joinpoint directly to the 2012 recommendation.
The treatment record makes this pattern harder to explain. The systemic therapies described above were introduced into clinical practice during the same period when the decline slowed. One reading consistent with the surveillance record is that these gains were offset by a shift toward more advanced disease at presentation. National incidence turned from an annual decline of 6.4% during 2007 to 2014 to an annual rise of 3.0% during 2014 to 2021, with the steepest increases in regional-stage and distant-stage disease [], while stage at diagnosis shifted toward more advanced disease [, ]. The same report describes a slowing of the national mortality decline to about 0.6% per year over the past decade [], closely matching our estimate of 0.59% for 2014 to 2020. Population-level mortality may also respond to new therapies only after a delay, with the magnitude of benefit depending on their uptake and accessibility.
Aziz et al. [] analyzed the same database over the same 1999-2020 period, and Chai et al. [] extended observation to 2023 across comparable subgroups. Both restricted their analyses to men aged 45 years and older, which helps explain why their absolute rates are higher than ours, which cover men of all ages. The direction and timing of the trends are consistent. We therefore do not present this study as the most current national estimate. Its incremental contribution is the use of a common framework that places four findings side by side: the inclusion of the full male population in the primary rates; the separate modeling by Hispanic origin; the comparison of subgroup-specific inflection years; and the evaluation of whether racial and urban-rural gaps changed in absolute and relative terms. Within this framework, Hispanic men had joinpoints in 2002 and 2014, and a final-segment decline of 1.14% per year, whereas the identified inflection years differed for Black men and for men in the South and West. These additions refine the description of disparity trajectories, but do not replace analyses that extend surveillance beyond 2020.
Black men had the highest mortality throughout the study period, and their AAMR in 2020 remained about twice that of White men, indicating a narrowing but incomplete convergence. The steepest decline in any stratum occurred among Black men between 2011 and 2014 (APC, -5.49%), followed immediately by a near-flat segment from 2015 to 2020 (APC, -0.84%). Thus, the rapid decline was not sustained. Both biological and structural explanations have been offered. Differences in tumor aggressiveness and germline profile have been described [], yet equal-access studies report comparable cancer-specific outcomes once treatment is standardized [, ], which points to access, insurance coverage, and diagnostic delay as important contributors [].
The 2.27-fold variation across states, with the highest-burden states clustered in the South, is only partly explained by racial composition, since regional differences persist within racial strata []. The West stands apart, exhibiting no significant decline in its final segment (APC, +0.11%; p=0.707), despite having the lowest regional rate in 1999. Nonmetropolitan areas had higher mortality at both ends of the period, and the near-identical AAPCs across all six urban-rural categories mean that the absolute difference narrowed while the relative disadvantage persisted [].
Mortality remained heavily concentrated in older men. Relative declines were largest in men aged 65 years and older and smallest in those aged 55 to 64 years, indicating that progress was uneven across the age range. Screening and treatment decisions in the oldest men must weigh life expectancy and comorbidities against competing causes of death; however, the present analysis includes no data on screening or treatment and cannot directly inform those decisions.
These findings are relevant beyond the U.S., but the numerical rates and joinpoint years should not be directly transferred to other health systems. The U.S. pattern emerged from a specific combination of PSA screening recommendations, insurance and access structures, racial inequities, and treatment diffusion. European countries differ in screening policy, diagnostic pathways, and access to contemporary therapy, while prostate cancer mortality also varies several-fold by country, income level, and world region [, ]. Türkiye has no organized population-based PSA screening program [], and detection occurs largely through opportunistic testing and symptom-driven evaluation. For Türkiye and Europe, the more transferable implication is methodological: surveillance should track age-standardized mortality, together with absolute and relative disparities by geography and healthcare access, and interpret changes alongside local screening, stage-at-diagnosis, and treatment patterns. Country-specific data are required before attributing a U.S. inflection to another setting.
Study Limitations
This study has several limitations. The analysis is ecological; associations observed at the population level cannot be applied to individuals. Cause of death was obtained from death certificates, which are subject to misclassification. Race and Hispanic origin recorded on death certificates may be reported by an informant or assigned by observation rather than obtained from the decedent, and the net misclassification differs substantially across groups. Deaths are estimated to be underreported by about 34% for the American Indian and Alaska Native population and by about 3% for the Asian or Pacific Islander and Hispanic-origin populations []. Estimates for these strata, particularly for American Indian and Alaska Native men, should therefore be interpreted with caution. The database contains no information on stage, PSA level, Gleason score, comorbidities or treatment; therefore, we could not directly examine mechanisms. We did not analyze incidence; therefore, the contributions of changes in early detection and treatment cannot be separated. The analytic dataset was locked at 2020, whereas mortality data are now available through 2023 []; consequently, this is a historical 1999-2020 analysis rather than a contemporary update, and the additional years could alter the slope of the final segment. The final segment also includes 2020, the first year of the Coronavirus disease-2019 pandemic, which disrupted cancer diagnosis and care delivery. Hispanic origin was not stated for 0.2% of deaths, which may have introduced minor uncertainty into the corresponding subgroup estimates. Because only deaths in which prostate cancer was the underlying cause were counted, deaths in which prostate cancer contributed but was not the underlying cause were not captured; therefore, the total burden associated with the disease is underestimated. Strengths include complete national coverage over 22 years and a consistent, multidimensional framework for comparing inflection-point timing and disparity trajectories.
Conclusion
Prostate cancer mortality among men in the U.S. fell substantially between 1999 and 2020, but the decline slowed sharply after 2013. Within this historical period, the racial gap narrowed but did not close; the absolute urban-rural difference narrowed but the relative disadvantage persisted; and regional differences did not narrow uniformly, with the West moving from the lowest regional rate in 1999 to the highest in 2020. These findings support continued, setting-specific surveillance that evaluates overall mortality together with absolute and relative disparities. Analyses incorporating 2021-2023 data are needed to determine whether the final-segment slope and observed slowing persisted.
Footnotes
Ethics
Ethics Committee Approval and Informed Consent: This study used de-identified, publicly available, aggregated data from the CDC WONDER database. Because the dataset contains no individually identifiable information, institutional review board approval and informed consent were not required.
Authorship Contributions
Concept: E.Y., G.İ.İ., Ö.B.Ç.Ö., O.S., Design: E.Y., G.C.U., O.S., Data Collection or Processing: E.Y., G.C.U., K.B., K.B.Y., Analysis or Interpretation: E.Y., G.C.U., G.İ.İ., Ö.B.Ç.Ö., O.S., Literature Search: E.Y., K.B., K.B.Y., Writing: E.Y., O.S.
Conflict of Interest: No conflict of interest was declared by the authors.
Financial Disclosure: The authors declared that this study received no financial support.
References
Siegel RL, Kratzer TB, Wagle NS, Sung H, Jemal A. Cancer statistics, 2026. CA Cancer J Clin. 2026;76:e70043.
Tannock IF, de Wit R, Berry WR, et al. Docetaxel plus prednisone or mitoxantrone plus prednisone for advanced prostate cancer. N Engl J Med. 2004;351:1502-1512.
de Bono JS, Logothetis CJ, Molina A, et al. Abiraterone and increased survival in metastatic prostate cancer. N Engl J Med. 2011;364:1995-2005.
Scher HI, Fizazi K, Saad F, et al. Increased survival with enzalutamide in prostate cancer after chemotherapy. N Engl J Med. 2012;367:1187-1197.
Sweeney CJ, Chen YH, Carducci M, et al. Chemohormonal therapy in metastatic hormone-sensitive prostate cancer. N Engl J Med. 2015;373:737-746.
Moyer VA. Screening for prostate cancer: U.S. Preventive services task force recommendation statement. Ann Intern Med. 2012;157:120-134.
Drazer MW, Huo D, Eggener SE. National prostate cancer screening rates after the 2012 US preventive services task force recommendation discouraging prostate-specific antigen-based screening. J Clin Oncol. 2015;33:2416-2423.
Negoita S, Feuer EJ, Mariotto A, et al. Annual report to the nation on the status of cancer, part II: recent changes in prostate cancer trends and disease characteristics. Cancer. 2018;124:2801-2814.
Butler SS, Muralidhar V, Zhao SG, et al. Prostate cancer incidence across stage, NCCN risk groups, and age before and after USPSTF Grade D recommendations against prostate-specific antigen screening in 2012. Cancer. 2020;126:717-724.
Dess RT, Hartman HE, Mahal BA, et al. Association of black race with prostate cancer-specific and other-cause mortality. JAMA Oncol. 2019;5:975-983.
Chowdhury-Paulino IM, Ericsson C, Vince R Jr, Spratt DE, George DJ, Mucci LA. Racial disparities in prostate cancer among black men: epidemiology and outcomes. Prostate Cancer Prostatic Dis. 2022;25:397-402.
Henley SJ, Anderson RN, Thomas CC, Massetti GM, Peaker B, Richardson LC. Invasive cancer incidence, 2004-2013, and deaths, 2006-2015, in nonmetropolitan and metropolitan counties - United States. MMWR Surveill Summ. 2017;66:1-13.
Singh GK, Williams SD, Siahpush M, Mulhollen A. Socioeconomic, rural-urban, and racial inequalities in US cancer mortality: part I-all cancers and lung cancer and part II-colorectal, prostate, breast, and cervical cancers. J Cancer Epidemiol. 2011;2011:107497.
Aziz N, Nabi W, Khan M, et al. Trends and disparities in prostate cancer mortality in the United States (1999-2020). Clin Genitourin Cancer. 2025;23:102298.
Chai Z, Yan S, Li H, et al. Temporal trends and regional disparities in prostate cancer mortality in the United States, 1999-2023: an analysis of the CDC WONDER database. BMC Public Health. 2025;25:4263.
Ghazwani Y, Alghafees M, Suheb MK, et al. Trends in genitourinary cancer mortality in the United States: analysis of the CDC-WONDER database 1999-2020. Front Public Health. 2024;12:1354663.
Centers for Disease Control and Prevention, National Center for health statistics. Multiple cause of death 1999-2020 on CDC WONDER Online Database. Last accessed date: July 10, 2026. Available from: https://wonder.cdc.gov/mcd-icd10.html
Ingram DD, Franco SJ. 2013 NCHS urban-rural classification scheme for counties. Vital Health Stat 2. 2014;166:1-73.
Anderson RN, Rosenberg HM. Age standardization of death rates: implementation of the year 2000 standard. Natl Vital Stat Rep. 1998;47:1-16, 20.
Clegg LX, Hankey BF, Tiwari R, Feuer EJ, Edwards BK. Estimating average annual per cent change in trend analysis. Stat Med. 2009;28:3670-3682.
Kim HJ, Fay MP, Feuer EJ, Midthune DN. Permutation tests for joinpoint regression with applications to cancer rates. Stat Med. 2000;19:335-351.
Grossman DC, Curry SJ, Owens DK, et al. Screening for prostate cancer: US Preventive Services Task Force recommendation statement. JAMA. 2018;319:1901-1913.
Schröder FH, Hugosson J, Roobol MJ, et al. Screening and prostate cancer mortality: results of the European Randomised Study of Screening for Prostate Cancer (ERSPC) at 13 years of follow-up. Lancet. 2014;384:2027-2035.
Andriole GL, Crawford ED, Grubb RL 3rd, et al. Mortality results from a randomized prostate-cancer screening trial. N Engl J Med. 2009;360:1310-1319.
Kratzer TB, Mazzitelli N, Star J, Dahut WL, Jemal A, Siegel RL. Prostate cancer statistics, 2025. CA Cancer J Clin. 2025;75:485-497.
Lowder D, Rizwan K, McColl C, et al. Racial disparities in prostate cancer: a complex interplay between socioeconomic inequities and genomics. Cancer Lett. 2022;531:71-82.
Mahal BA, Berman RA, Taplin ME, Huang FW. Prostate cancer-specific mortality across Gleason scores in black vs nonblack men. JAMA. 2018;320:2479-2481.
Bray F, Laversanne M, Sung H, et al. Global cancer statistics 2022: GLOBOCAN estimates of incidence and mortality worldwide for 36 cancers in 185 countries. CA Cancer J Clin. 2024;74:229-263.
Dudipala H, Jani CT, Gurnani SD, et al. Evolving global trends in prostate cancer: disparities across income levels and geographic regions (1990-2019). JCO Glob Oncol. 2025;11:e2500249.
Republic of Türkiye Ministry of Health, General Directorate of Public Health. Cancer Screenings. Last accessed date: July 30, 2026. Available from: https://hsgm.saglik.gov.tr/tr/kanser-taramalari
Arias E, Heron M, Hakes J; National Center for Health Statistics; US Census Bureau. The validity of race and Hispanic-origin reporting on death certificates in the United States: an update. Vital Health Stat 2. 2016;172:1-21.
Supplementary Materials
Supplementary Tables 1-2
Download