
Abstract
Aim
The aim of our study was to determine the role of preoperative primary tumor diameter (PTD) and maximum standardized uptake (SUVmax) values on preoperative 18F-fluorodeoxyglucose positron emission tomography/computed tomography (18F-FDG PET/CT) in predicting regional lymph node (LN) involvement, lymphatic invasion (LI), vascular invasion (VI), and pleural invasion (PI) in patients with non-small cell lung cancer (NSCLC) who were operated without receiving neoadjuvant therapy.
Methods
A total of 70 patients diagnosed with NSCLC who underwent surgery after 18F-FDG PET/CT but did not receive neoadjuvant therapy were retrospectively examined. The effects of PTD and SUVmax on postoperative LN involvement, LI, VI, and PI in patient groups below and above the determined threshold value on preoperative 18F-FDG PET/CT were compared. Since an optimal cut-off value for specificity and sensitivity was not obtained with the receiver operating characteristic curve for both the PTD and SUVmax of the primary tumor, patients were grouped based on the median values for the two parameters.
Results
The median PTD was 32 mm. The median SUVmax of 12.55 was obtained, and patients were grouped according to these median values. No significant difference was found in the primary tumor diameters ≥32 mm and <32 mm in terms of pathological LN involvement (p=0.322), VI (p=0.122), LI (p=0.122) and PI (p=1.000). Again, no significant difference was found in the patient groups with SUVmax values of the primary tumor ≥12.55 and <12.55 regarding pathological LN involvement (p=0.621), VI (p=0.122), LI (p=0.122), and PI (p=1.000). A low positive correlation (p=0.000, r=0.447) was found between the PTD and SUVmax values.
Conclusion
18F-FDG PET/CT alone is not a reliable noninvasive method for predicting LN metastasis in patients with early-stage NSCLC for whom curative treatment is planned.
Keywords: Lung cancer, 18F-FDG PET/CT, invasion, lymph node involvement
Introduction
Non-small-cell lung cancer (NSCLC) accounts for 85% of all lung cancer cases. Approximately 40% of cases are metastatic upon diagnosis [, ]. Curative treatment modalities (surgery, chemoradiotherapy) are chosen based on the stage of the remaining non-metastatic patients.
The precise staging of NSCLC, particularly preoperative identification of lymph node (LN) metastasis, is critical for treatment planning and prognosis determination.
LN metastasis is a significant prognostic factor in patients with NSCLC because it is associated with a worse prognosis. This is because LN metastases often indicate that the cancer has spread beyond the lung to other parts of the body.
Patients with NSCLC who have larger tumors have an increased risk of LN metastasis. This is because larger tumors are more likely to invade the lymphatic system, which is a network of vessels containing white blood cells and other immune cells throughout the body.
LN metastasis can be determined by invasive or non-invasive methods. Non-invasive imaging methods, such as computed tomography (CT) and 18F-fluorodeoxyglucose positron emission tomography-CT (18F-FDG PET/CT), are widely used to identify involvement of the ipsilateral (N2) or contralateral mediastinal LNs (N3). Mediastinoscopy and endobronchial ultrasound-guided transbronchial needle aspiration are two invasive staging procedures that are frequently used after non-invasive staging results from CT and 18F-FDG PET/CT scans. 18F-FDG PET/CT using 18F-FDG, a glucose analog shown to be useful in detecting malignancy, is an extremely important imaging method in the staging of NSCLC. Here, the maximum standardized uptake value (SUVmax) of the primary tumor and primary tumor diameter (PTD) can be used to predict the risk of nodal metastasis, and the threshold SUVmax value is between 2.5 and 4.0 [].
Although invasive methods remain the gold standard for mediastinal nodal staging, they come with disadvantages, such as the risk of complications, delay in treatment, and high cost. Hence, the correct use of non-invasive mediastinal nodal staging will help in selecting patients who will benefit most from invasive staging and preventing unnecessary invasive procedures. However, in patients clinically staged as N0 (no nodal involvement) on preoperative 18F-FDG PET/CT, the incidence of histologically proven occult nodal metastasis after surgery has been found to range between 8% and 58% in various stages [, ].
The relationship between PTD and LN metastases in clinical staging and the proper selection of treatment methods has been investigated in many previous studies. Some studies have revealed a close relationship between these two factors, suggesting that PTD could be used to predict positive LN metastases [, ]. However, others have concluded that there is no such specific correlation between these two factors [, ]. It is believed that combining the PTD and SUVmax values may provide a more sensitive method for detecting pathological LN metastasis.
In this study, we aimed to determine the role of the PTD and SUVmax in preoperative 18F-FDG PET/CT in predicting regional LN involvement, lymphatic invasion (LI), vascular invasion (VI), and pleural invasion (PI) in patients with NSCLC who were operated on without neoadjuvant therapy.
Methods
The computer registration system of our hospital was reviewed, and the archive file records of 70 patients who were diagnosed with NSCLC at the medical oncology clinic between October 2014 and February 2023 and who underwent surgery (segmentectomy, lobectomy, bilobectomy, pneumonectomy) after 18F-FDG PET/CT without receiving neoadjuvant therapy were retrospectively examined. The effects of PTD and SUVmax on postoperative LN, lymphatic, vascular, and PI in patient groups below and above the determined threshold value on preoperative 18F-FDG PET/CT were compared. Since an optimal cut-off value for specificity and sensitivity was not obtained with the receiver operating characteristic (ROC) curve for both the PTD and SUVmax of the primary tumor, patients were grouped based on the median values for the two parameters.
The demographic and clinical characteristics of the patients included in the study are presented in . Parameters such as PTD and SUVmax in preoperative 18F-FDG PET/CT and histopathological diagnosis of the tumor in postoperative pathology reports, LN involvement, LI, VI, and PI were recorded. The effects of PTD and SUVmax on pathological LN involvement, LI, VI, and PI were compared between patient groups below and above the determined threshold value. The median follow-up period was 30.4 (0.17-112.7).
Table 1. Demographics and clinical characteristics of all patients
n | % | ||
|---|---|---|---|
Gender | Male | 60 | 85.7 |
Female | 10 | 14.3 | |
Age | Median (min-max) | 68 (48-91) | |
Smoking | Never | 5 | 7.1 |
Current or ex-smoker | 65 | 92.9 | |
Smoking duration (pack years) | Median (min-max) | 40 (0-100) | |
ECOG | 0 | 28 | 40.0 |
1 | 42 | 60.0 | |
Localization | Right | 47 | 67.1 |
Left | 23 | 32.9 | |
Surgery | Segmentectomy | 7 | 10.0 |
Lobectomy | 52 | 74.3 | |
Bilobectomy | 3 | 4.3 | |
Pneumonectomy | 8 | 11.4 | |
Histological type | SCC | 38 | 54.3 |
Adeno | 32 | 45.7 | |
Adjuvant chemotherapy | Did not receive | 22 | 31.4 |
Received | 48 | 68.6 | |
Adjuvant radiotherapy | Did not receive | 60 | 85.7 |
Received | 10 | 14.3 | |
ECOG: Eastern Cooperative Oncology Group, SCC: Squamous cell cancers, Min-max: Minimum-maximum
This study was planned and conducted in accordance with Good Clinical Practices and the Declaration of Helsinki, and it was approved by the Ethics Committee of Aydın Adnan Menderes University Hospital (approval no: E-53043469-050.04.04-346879, date: 11.05.2023).
Statistical Analysis
Data were summarized using descriptive statistics, such as mean, standard deviation, median, minimum, maximum, frequency, and ratio. The distribution of variables was assessed using the Kolmogorov-Smirnov test. Independent quantitative data were analyzed using independent sample t-tests and Mann-Whitney U tests. The chi-square test was employed for qualitative independent data, with the Fisher’s test used when conditions for the chi-square test were not met. ROC curve analysis was performed to maximize the sensitivity, specificity, and accuracy for assessing the cut-off value for PTD and SUVmax. A p value of less than 0.05 was considered statistically significant. Statistical Package for the Social Sciences 22.0 software was used for the analyses.
Results
For the PTD and SUVmax values of the primary tumor, since a cut-off value could not be obtained with the ROC curve with optimal specificity and sensitivity, patients were divided into 2 groups based on the median values.
There was no significant difference in age between patients with a PTD of ≥32 mm and <32 mm (p=0.073). In the group with ≥32 mm, the male gender was found to be more predominant (p=0.040) ().
Table 2. Demographic and clinical characteristics of patients according to tumor diameter
Tumor diameter <32 mm | Tumor diameter ≥32 mm | p | |||||||||
|---|---|---|---|---|---|---|---|---|---|---|---|
Mean±SD | Median | Mean±SD | Median | ||||||||
Age | 67.43 | ± | 8.68 | 69 (48-88) | 67.97 | ± | 10.48 | 68 (43-91) | 0.073 | t | |
Gender | Male | 27 | 77.1% | 33 | 94.3% | 0.040 | x² | ||||
Female | 8 | 22.9% | 2 | 5.7% | |||||||
Smoking | Never smoked | 4 | 11.4% | 1 | 2.9% | 0.164 | x² | ||||
Smoked | 31 | 88.6% | 34 | 97.1% | |||||||
Smoking duration (pack years) | 38.09 | ± | 18.23 | 40.00 | 40.43 | ± | 22.31 | 35.00 | 0.506 | m | |
ECOG | 0 | 16 | 45.7% | 12 | 34.3% | 0.329 | x² | ||||
1 | 19 | 54.3% | 23 | 65.7% | |||||||
Localization | Right | 21 | 60.0% | 26 | 74.3% | 0.203 | x² | ||||
Left | 14 | 40.0% | 9 | 25.7% | |||||||
Histological type | Squamous carcinoma | 16 | 45.7% | 22 | 62.9% | 0.150 | x² | ||||
Adenocarcinoma | 19 | 54.3% | 13 | 37.1% | |||||||
Adjuvant chemotherapy | Did not receive | 18 | 51.4% | 4 | 11.4% | 0.000 | x² | ||||
Received | 17 | 48.6% | 31 | 88.6% | |||||||
Adjuvant radiotherapy | Did not receive | 29 | 82.9% | 31 | 88.6% | 0.495 | x² | ||||
Received | 6 | 17.1% | 4 | 11.4% | |||||||
t: Independent samples t-test, m: Mann-Whitney U test, x2: Chi-square test, ECOG: Eastern Cooperative Oncology Group, SD: Standard deviation
The number of patients who smoked (p=0.164), the smoking duration (p=0.506), Eastern Cooperative Oncology Group (ECOG) status (p=0.329), tumor localization (p=0.203), and histological subtype (p=0.150) did not significantly differ between the groups. The number of patients who received adjuvant chemotherapy was significantly higher in the group with a PTD of ≥32 mm (p=0.000). There was no significant difference in the number of patients who received adjuvant radiotherapy (p=0.495, ).
Age was not significantly different (p=0.073) in the groups of patients with SUVmax values ≥12.55 and <12.55 for the primary tumor. Regarding gender distribution, male sex was more predominant (p=0.040) in the group with SUVmax ≥12.55 ().
Table 3. Demographic and clinical characteristics of patients by SUVmax value
SUVmax value <12.55 | SUVmax value ≥12.55 | p | |||||||||
|---|---|---|---|---|---|---|---|---|---|---|---|
Mean±SD | Median (min-max) | Mean±SD | Median (min-max) | ||||||||
Age | 65.7 | ± | 9.7 | 67 (43-88) | 69.7 | ± | 9.1 | 70 (48-91) | 0.073 | t | |
Gender | Male | 27 | 77.1% | 33 | 94.3% | 0.040 | x2 | ||||
Female | 8 | 22.9% | 2 | 5.7% | |||||||
Smoking | Never smoked | 3 | 8.6% | 2 | 5.7% | 0.643 | x2 | ||||
Smoked | 32 | 91.4% | 33 | 94.3% | |||||||
Smoking duration (pack-years) | 37.1 | ± | 16.4 | 40 (0-70) | 41.4 | ± | 23.5 | 40 (0-100) | 0.948 | m | |
ECOG | 0 | 15 | 42.9% | 13 | 37.1% | x2 | |||||
1 | 20 | 57.1% | 22 | 62.9% | 0.626 | ||||||
Localization | Right | 21 | 60.0% | 26 | 74.3% | 0.203 | x2 | ||||
Left | 14 | 40.0% | 9 | 25.7% | |||||||
Histological type | Squamous carcinoma | 15 | 42.9% | 23 | 65.7% | 0.055 | x2 | ||||
Adenocarcinoma | 20 | 57.1% | 12 | 34.3% | |||||||
Adjuvant chemotherapy | Did not receive | 17 | 48.6% | 5 | 14.3% | 0.002 | x2 | ||||
Received | 18 | 51.4% | 30 | 85.7% | |||||||
Adjuvant radiotherapy | Did not receive | 30 | 85.7% | 30 | 85.7% | 1.000 | x2 | ||||
Received | 5 | 14.3% | 5 | 14.3% | |||||||
t: Independent samples t-test, m: Mann-Whitney U test, x2: Chi-square test, ECOG: Eastern Cooperative Oncology Group, SD: Standard deviation, Min-max: Minimum-maximum, SUVmax: Maximum standardized uptake
No significant differences were observed between the groups in the number of patients who smoked (p=0.643), duration of smoking (p=0.948), ECOG status (p=0.626), tumor localization (p=0.203), or histological subtype (p=0.055). In the group with a primary tumor SUVmax value ≥12.55, the number of patients who received adjuvant chemotherapy was significantly higher (p=0.002). Adjuvant radiotherapy was not significantly different between the number of patients who received it (p=1.000) ().
Pathological LN involvement (p=0.322), VI (p=0.122), LI (p=0.122), and PI (p=1.000) were not significantly different between the two groups according to PTD ().
Table 4. Relationship between tumor size and microscopic tumor spread in pathological samples
Tumor diameter <32 mm | Tumor diameter ≥32 mm | p | |||||
|---|---|---|---|---|---|---|---|
n | % | n | % | ||||
Pathological N factor | N0 | 24 | 72.7% | 20 | 57.1% | 0.322 | x2 |
N1-3 | 11 | 33.3% | 15 | 42.9% | |||
Venous invasion | Absent | 14 | 42.4% | 8 | 22.9% | 0.122 | x2 |
Present | 21 | 63.6% | 27 | 77.1% | |||
Lymphatic invasion | Absent | 14 | 42.4% | 8 | 22.9% | 0.122 | x2 |
Present | 21 | 63.6% | 27 | 77.1% | |||
Pleural invasion | Absent | 23 | 69.7% | 23 | 65.7% | 1.000 | x2 |
Present | 12 | 36.4% | 12 | 34.3% | |||
x2: Chi-square test
Regarding the SUVmax values of the primary tumor, no significant difference was found between the two groups in terms of the pathological LN involvement (p=0.621), VI (p=0.122), LI (p=0.122) and PI (p=1.000) ().
Table 5. Relationship between SUVmax and microscopic tumor spread in pathological samples
Primary tumor SUVmax <12.55 | Primary tumor SUVmax ≥12.55 | p | |||||
|---|---|---|---|---|---|---|---|
n | % | n | % | ||||
Pathological N factor | N0 | 23 | 65.7% | 21 | 60.0% | 0.621 | x2 |
N1-3 | 12 | 34.3% | 14 | 40.0% | |||
Venous invasion | Absent | 14 | 40.0% | 8 | 22.9% | 0.122 | x2 |
Present | 21 | 60.0% | 27 | 77.1% | |||
Lymphatic invasion | Absent | 14 | 40.0% | 8 | 22.9% | 0.122 | x2 |
Present | 21 | 60.0% | 27 | 77.1% | |||
Pleural invasion | Absent | 23 | 65.7% | 23 | 65.7% | 1.000 | x2 |
Present | 12 | 34.3% | 12 | 34.3% | |||
x2: Chi-square test, SUVmax: Maximum standardized uptake
A low positive correlation was observed between the PTD and SUVmax values (p=0.000, r=0.447) ().
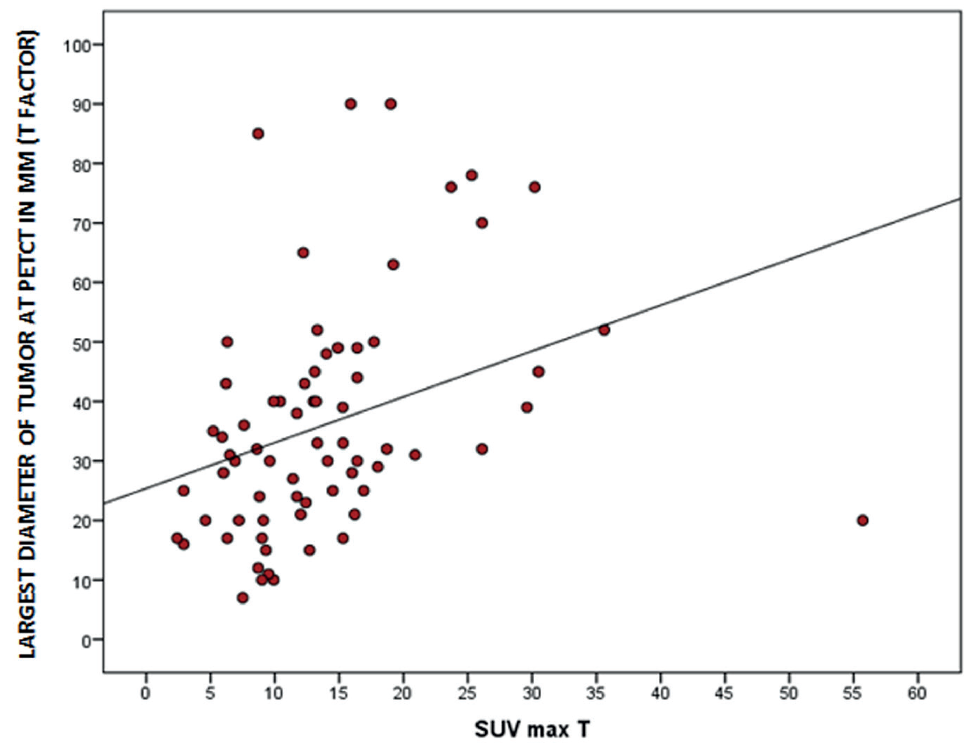
SUVmax: Maximum standardized uptake, PET/CT: Positron emission tomography/computed tomography
Discussion
Our study showed that the preoperative PTD and SUVmax on 18F-FDG PET/CT were insufficient to predict pathological LN involvement in patients with NSCLC.
In clinical stage 1A patients, the prevalence of LN metastasis is low, and because of high false-positive rates, the role of 18F-FDG PET/CT is limited [, ]. Additionally, a study has shown that the utility of 18F-FDG PET/CT in predicting LN metastasis in subsolid lesions significantly decreases, with a sensitivity of 11.1%, specificity of 86.1%, and accuracy of 81.9% for LN staging in patients with subsolid adenocarcinomas (AC) with a PTD ≤3 cm [].
This study showed that the incidence of LN metastasis in lung cancer increased with tumor size. Seok et al. [] found that when patients were split into six groups based on tumor diameter: ≤0.5, 0.6-1, 1.1-1.5, 16-2.0, 2.1-2.5, and 2.6-3 cm, the rates of LN metastasis were 0%, 0%, 7%, 14%, 27%, and 31%. However, our study has shown similar results in terms of PTD among patients with NSCLC.
18F-FDG PET/CT is a valuable tool in oncology practice because it can be used to measure increased glucose metabolism in tumor cells. This is because tumor cells typically have a higher metabolic rate than normal cells, and they take up more glucose to fuel their growth. A SUVmax >2.5 is generally used as a cut-off value for malignancy. This indicates that lesions or tissues with an SUVmax >2.5 are more likely to be cancerous than those with an SUVmax 2.5. However, some benign conditions can also cause high 18F-FDG uptake, and there are some cancers that may have an SUVmax below 2.5.
Tuberculosis, obstructive pneumonia, anthracosis, or immune reactions resulting from granulomatous inflammation can lead to false-positive results. Low-grade malignancies can also result in false negatives [, ]. However, it is important to note that using a higher SUVmax cut-off value can also increase the false positive rate. This means that more patients will be identified as having metastasis even if they do not actually have metastasis. This can lead to unnecessary additional testing and procedures.
Some authors have claimed that using a higher SUVmax than the traditional 2.5 can increase the accuracy of metastasis presence. This is because a high SUVmax is more likely to indicate malignant tissue. However, it is important to note that no single SUVmax value is universally accurate for all cancer types. The optimal cut-off value varies depending on the specific type of cancer, tumor location, and other factors [].
The SUVmax value was also a good indicator of tumor aggressiveness []. However, a study conducted in patients with resected stage 1 NSCLC found that the cellular components in the tumor varied widely and therefore did not correlate with 18F-FGD activity [].
Tumor size and the presence of necrosis are other factors affecting a tumor’s SUVmax. Previous studies have shown a positive correlation between PTD and SUVmax [, ]. Similarly, in our study, a positive correlation was found between the PTD and SUVmax. However, there was no significant difference in pathological LN involvement between the two groups based on the SUVmax of the main tumor.
It is known that the likelihood of necrosis increases with tumor size, which is associated with a lower SUVmax. However, the relationship between SUVmax and necrosis was not evaluated in our study.
Tumor histologic type has also been identified to be associated with LN metastasis in patients with NSCLC. It is known that squamous cell cancers (SCC) have shorter doubling times and grow faster than AC, and therefore have higher glucose metabolism []. Moreover, glucose transporter-1 expression is higher in SCCs. Accordingly, previous studies have shown that SUVmax values are higher in SCC [-]. Kim et al. [] found that the SUVmax was 10.8±4.4 for SCC and 8.8±3.2 for AC.
However, contrary to this, our study showed no significant difference in PTDs and SUVmax values according to histological subtype.
In studies involving patients with early-stage NSCLC, a high primary tumor SUVmax was found to be a strong indicator of lymphovascular invasion (LVI) and LN metastasis [, ]. In a study conducted by Koksal et al. [], it was found that the SUVmax of the tumor did not correlate with the nodal (N) stage, and the median SUVmax did not show a significant difference between groups with and without LN metastasis. Similarly, in our study, the tumor SUVmax was insufficient to predict pathological LN metastasis. Additionally, no significant relationship was observed between SUVmax and LVI or PI.
Study Limitations
The important limitations of our study are its non-randomized and retrospective nature. In addition, the small number of patients might have affected the study outcome. Therefore, we believe that prospective studies with large cohorts are needed to evaluate the utility of preoperative 18F-FDG PET/CT in predicting LN involvement.
Conclusion
Ultimately, the decision to use a higher SUVmax cut-off value should be made on a case-by-case basis in consultation with a medical oncologist.
Footnotes
Ethics
Ethics Committee Approval: The study was approved by the Aydın Adnan Menderes University Hospital of Ethics Committee (approval no: E-53043469-050.04.04-346879, date: 11.05.2023).
Informed Consent: Retrospective study.
Authorship Contributions
Surgical and Medical Practices: A.A., B.D., S.B., Y.Y., Concept: A.A., S.B., Design: A.A., S.B., Data Collection or Processing: A.A., B.D., Analysis or Interpretation: A.A., B.D., S.B., Y.Y., Literature Search: A.A., B.D., Writing: A.A.
Conflict of Interest: No conflict of interest was declared by the authors.
Financial Disclosure: The authors declared that this study received no financial support.
References
Sher T, Dy GK, Adjei AA. Small cell lung cancer. Mayo Clin Proc. 2008;83:355-367.
United States, Department of Health and Human Services, National Institutes of Health, National Cancer Institute (NCI). Non-Small Cell Lung Cancer Treatment (PDQ®)–Health Professional Version: Stage Information for NSCLC. Bethesda, MD: NCI; 2020.
Takahashi Y, Suzuki S, Matsutani N, Kawamura M. 18F-fluorodeoxyglucose positron emission tomography/computed tomography in the evaluation of clinically node-negative non-small cell lung cancer. Thorac Cancer. 2019;10:413-420.
Iskender I, Kadioglu SZ, Cosgun T, et al. False-positivity of mediastinal lymph nodes has negative effect on survival in potentially resectable non-small cell lung cancer. Eur J Cardiothorac Surg. 2012;41:874-879.
Schmidt-Hansen M, Baldwin DR, Hasler E, Zamora J, Abraira V, Roqué I Figuls M. PET-CT for assessing mediastinal lymph node involvement in patients with suspected resectable non-small cell lung cancer. Cochrane Database Syst Rev. 2014;2014:CD009519.
Yang H, Fan HX, Song LH, Xie JC, Fan SF. Relationship between contrast-enhanced CT and clinicopathological characteristics and prognosis of non-small cell lung cancer. Oncol Res Treat. 2017;40:516-522.
Kong M, Jin J, Cai X, et al. Characteristics of lymph node metastasis in resected adenosquamous lung cancer. Medicine (Baltimore). 2017;96:e8870.
Zhang Y, Sun Y, Shen L, et al. Predictive factors of lymph node status in small peripheral non-small cell lung cancers: tumor histology is more reliable. Ann Surg Oncol. 2013;20:1949-1954.
Patz EF Jr, Rossi S, Harpole DH Jr, Herndon JE, Goodman PC. Correlation of tumor size and survival in patients with stage IA non-small cell lung cancer. Chest. 2000;117:1568-1571.
Kozower BD, Meyers BF, Reed CE, Jones DR, Decker PA, Putnam JB Jr. Does positron emission tomography prevent nontherapeutic pulmonary resections for clinical stage IA lung cancer? Ann Thorac Surg. 2008;85:1169-1170.
Port JL, Andrade RS, Levin MA, et al. Positron emission tomographic scanning in the diagnosis and staging of non-small cell lung cancer 2 cm in size or less. J Thorac Cardiovasc Surg. 2005;130:1611-1615.
Lee SM, Park CM, Paeng JC, et al. Accuracy and predictive features of FDG-PET/CT and CT for diagnosis of lymph node metastasis of T1 nonsmall-cell lung cancer manifesting as a subsolid nodule. Eur Radiol. 2012;22:1556-1563.
Seok Y, Yang HC, Kim TJ, et al. Frequency of lymph node metastasis according to the size of tumors in resected pulmonary adenocarcinoma with a size of 30 mm or smaller. J Thorac Oncol. 2014;9:818-824.
Rankin S. PET/CT for staging and monitoring non-small cell lung cancer. Cancer Imaging. 2008;8:27-31.
Konishi J, Yamazaki K, Tsukamoto E, et al. Mediastinal lymph node staging by FDG-PET in patients with non-small cell lung cancer: analysis of false-positive FDG-PET findings. Respiration. 2003;70:500-506.
Bryant AS, Cerfolio RJ, Klemm KM, Ojha B. Maximum standard uptake value of mediastinal lymph nodes on integrated FDG-PET-CT predicts pathology in patients with non-small cell lung cancer. Ann Thorac Surg. 2006;82:422-423.
Berghmans T, Dusart M, Paesmans M, et al. Primary tumor standardized uptake value (SUVmax) measured on fluorodeoxyglucose positron emission tomography (FDG-PET) is of prognostic value for survival in non-small cell lung cancer (NSCLC): a systematic review and meta-analysis (MA) by the European Lung Cancer Working Party for the IASLC Lung Cancer Staging Project. J Thorac Oncol. 2008;3:6-12.
Christensen JD, Colby TV, Patz EF Jr. Correlation of [18F]-2-fluoro-deoxy-D-glucose positron emission tomography standard uptake values with the cellular composition of stage I nonsmall cell lung cancer. Cancer. 2010;116:4095-4102.
Khalaf M, Abdel-Nabi H, Baker J, Shao Y, Lamonica D, Gona J. Relation between nodule size and 18F-FDG-PET SUV for malignant and benign pulmonary nodules. J Hematol Oncol. 2008;1:13.
Lu P, Yu L, Li Y, Sun Y. A correlation study between maximum standardized uptake values and pathology and clinical staging in nonsmall cell lung cancer. Nucl Med Commun. 2010;31:646-651.
Duhaylongsod FG, Lowe VJ, Patz EF Jr, Vaughn AL, Coleman RE, Wolfe WG. Lung tumor growth correlates with glucose metabolism measured by fluoride-18 fluorodeoxyglucose positron emission tomography. Ann Thorac Surg. 1995;60:1348-1352.
Suzawa N, Ito M, Qiao S, et al. Assessment of factors influencing FDG uptake in non-small cell lung cancer on PET/CT by investigating histological differences in expression of glucose transporters 1 and 3 and tumor size. Lung Cancer. 2011;72:191-198.
Li M, Sun Y, Liu Y, et al. Relationship between primary lesion FDG uptake and clinical stage at PET/CT for non-small cell lung cancer patients: An observation. Lung Cancer. 2010;68:394-397.
Al-Sarraf N, Gately K, Lucey J, et al. Clinical implication and prognostic significance of standardised uptake value of primary non-small cell lung cancer on positron emission tomography: analysis of 176 cases. Eur J Cardiothorac Surg. 2008;34:892-897.
Kim BT, Kim Y, Lee KS, et al. Localized form of bronchioloalveolar carcinoma: FDG PET findings. AJR Am J Roentgenol. 1998;170:935-939.
Ishibashi T, Kaji M, Kato T, Ishikawa K, Kadoya M, Tamaki N. 18F-FDG uptake in primary lung cancer as a predictor of intratumoral vessel invasion. Ann Nucl Med. 2011;25:547-553.
Koksal D, Demirag F, Bayiz H, et al. The correlation of SUVmax with pathological characteristics of primary tumor and the value of Tumor/ Lymph node SUVmax ratio for predicting metastasis to lymph nodes in resected NSCLC patients. J Cardiothorac Surg. 2013;8:63.